Exploratory Block
Analysis of Field Consciousness Effects on Global RNGs on September 11,
2001
by
Bryan J. Williams
Department of Psychology
University of New Mexico
e-mail: [email protected]
August 12, 2002
by
Bryan J. Williams
Department of Psychology
University of New Mexico
e-mail: [email protected]
August 12, 2002


Introduction: A metaphorical
“Great Disturbance in the Force?”
I felt a great disturbance in the Force...as though millions of voices had cried out in terror, and then were suddenly silenced...I feel that something terrible has happened...
- Obi-Wan Kenobi (portrayed by Sir Alec Guinness), from the film Star Wars (1977)
The September 11th terrorist attacks onAmerica
I felt a great disturbance in the Force...as though millions of voices had cried out in terror, and then were suddenly silenced...I feel that something terrible has happened...
- Obi-Wan Kenobi (portrayed by Sir Alec Guinness), from the film Star Wars (1977)
The September 11th terrorist attacks on
The
Global Consciousness Project (GCP) had been initiated in August 1998 in
order to more closely study this “global consciousness” hypothesis and
the PK effects that are thought to underlie it by setting up the first Internet-based,
worldwide network of random number generators (RNGs) and monitoring it for
any signs of this PK-based “global consciousness” effect during major world
events that tend to draw a wide degree of attention and bring about a large
emotional response (Nelson, 2001). The terrorist disaster of September 11,
2001 was just the kind of major world event that the GCP would expect to
create a strong emotion-related global consciousness because of the devastating
effect it had on people around the world. In the efforts to explore a possible
global consciousness, I carried out an independent exploratory analysis
of the September 11 events using the data from the GCP’s global RNG network
in a combined “block” form of 15-minutes in duration, which might allow for
long-spanning trends in the data over time to be seen. In this web paper,
I provide a summary of the results of my exploratory analysis, along with
some personal speculation and interpretation on what they could mean for
an ostensible “global consciousness.” (Note: in order to better understand
the results, it might be helpful for readers unfamiliar with PK and field
consciousness research to first read an illustrated introductory web paper
on the GCP written by the author, which can be found by clicking here.)
Formal Analysis 1: Cumulative Deviation from
Expectation The
formal global consciousness test prediction made by the GCP specified a
timeperiod over which it was thought that any PK-based global consciousness
effects would be seen in the data produced by 37 of the 38 global RNGs (which
are also called “EGGs;” the two terms “(global) RNG” and “EGG” are synonymous
and will be used interchangeably here) actively running in the network
that fateful day. The timeperiod specified began 10 minutes before the
first plane crashed into the North Tower of the World Trade Center (WTC)
and ended 4 hours after that, so that the timeframe over which the global
consciousness hypothesis would be formally tested ran from 8:35 A.M. - 12:45
P.M. Eastern Daylight Time (EDT). This timeperiod covers all the terrorist
events and adds about two and a half hours of
their aftermath.
For
this test prediction analysis, I followed the standard GCP procedure of
working the data using Chi-square values cumulatively combined over time
to represent a measure of the overall deviation, or departure, from the
expected level of random behavior among the RNGs (Nelson, 2001). Normally,
based on the inherently unpredictable nature of a truly random number generator,
we would expect the behavior of the global RNGs to be completely different
from each other, with their deviation from chance expectation at exactly
zero. It seems that when world events occur that greatly affect us, the global
RNGs tend to move away from randomness and show anomalous patterns in the
data that are beyond chance expectation. This is what the Chi-square technique
is intended to measure quantitatively, and since pictures speak a thousand
words (especially true in the case of 9/11), it is also possible these
anomalous patterns graphically through the technique. Thus, Figure 1 shows
my result for the formal prediction period in 15-minute block resolution.
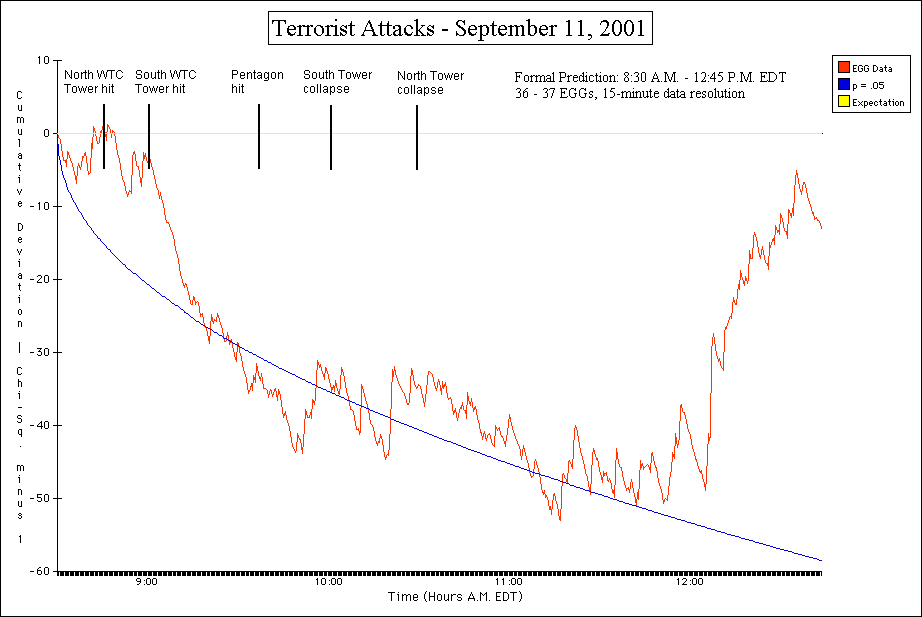
Figure 1. Cumulative deviation of Chi-Square graph of the formal prediction period in 15-minute blocks, 8:30 A.M. - 12:45 P.M. EDT, September 11, 2001. The blue curved arc shows the location of statistical significance (odds of 20 to 1 against chance) as time passes.
As
can be seen from the graph, there is a rather steady downward trend that
starts soon after the South WTC Tower
It
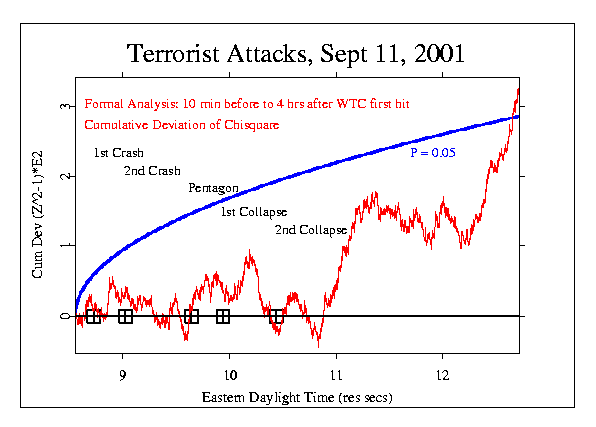
is interesting that in seconds resolution, there
is no distinct and immediate “reaction” by the global RNG network during
the major terrorist events, with the data showing a random walk. My corresponding
15-minute result in Figure 1 shows a strong negative trend after the South WTC Tower
Context Analysis: Examining Long-Term Effects of the Attacks
Given
the sheer magnitude and importance of its events, it becomes rather important
and subjectively meaningful to examine the larger context of the disaster,
which may also help us to learn more about the kind of impact such events
tend to have on the global RNG/EGG network. Figure 3 shows the context
of the entire day in Eastern time, with the terrorist attacks noted with
small vertical tickmarks along the pink expectation line of zero deviation.
The time resolution is again in terms of 15-minute intervals.
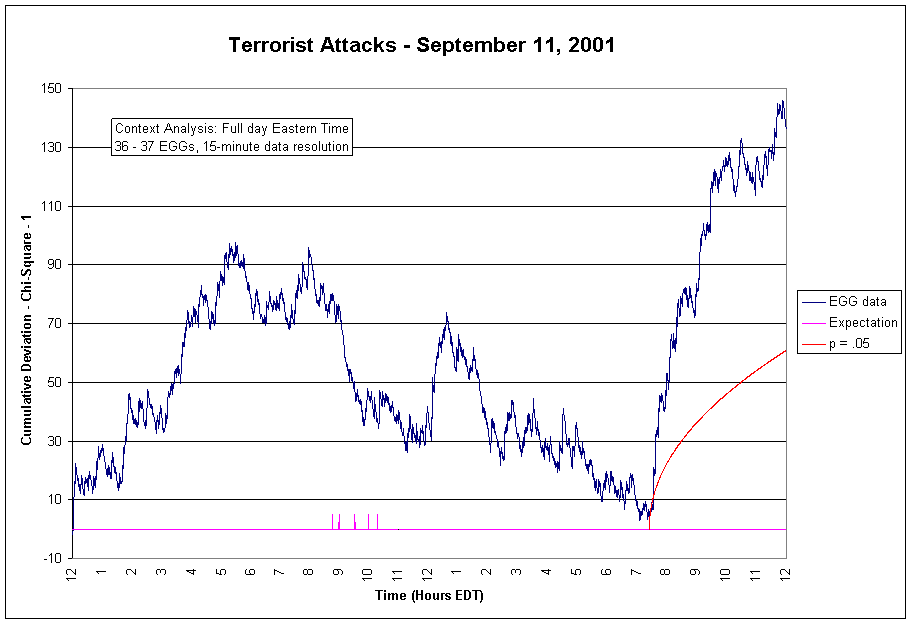
The trend for the entire day is quite remarkable,
particularly the very strong and steep positive trend that begins at around
7:30 P.M. EDT. It is clear that this trend is extremely deviant based on
how rapidly it departs from chance expectation (as measured by the area below
the red arc) over time. In examining the way the data is distributed statistically
over time, I found nothing to indicate that any of the RNGs were malfunctioning
and producing “bad data” at this time, so this suggests that the data are
being strongly “driven” by something external to the network. What is just
as remarkable as this strong trend at 7:30 is the trend that occurs before
it, in the early morning hours of September 11. It can be seen that the
data from midnight up until around 6:00 A.M. also steeply increase with
time, peaking at around 5:30 A.M. This suggests that there might have been
sort of a “pre-response” by the RNG network prior to the onset of the events
in New York Washington
Figure 4 takes a broader contextual view, focusing now on the three days surrounding September 11. The length of the day is measured in Universal Coordinate Time (UTC), the time that the RNGs are synchronized to, which is 4 hours ahead of Eastern time.
Figure 4 takes a broader contextual view, focusing now on the three days surrounding September 11. The length of the day is measured in Universal Coordinate Time (UTC), the time that the RNGs are synchronized to, which is 4 hours ahead of Eastern time.
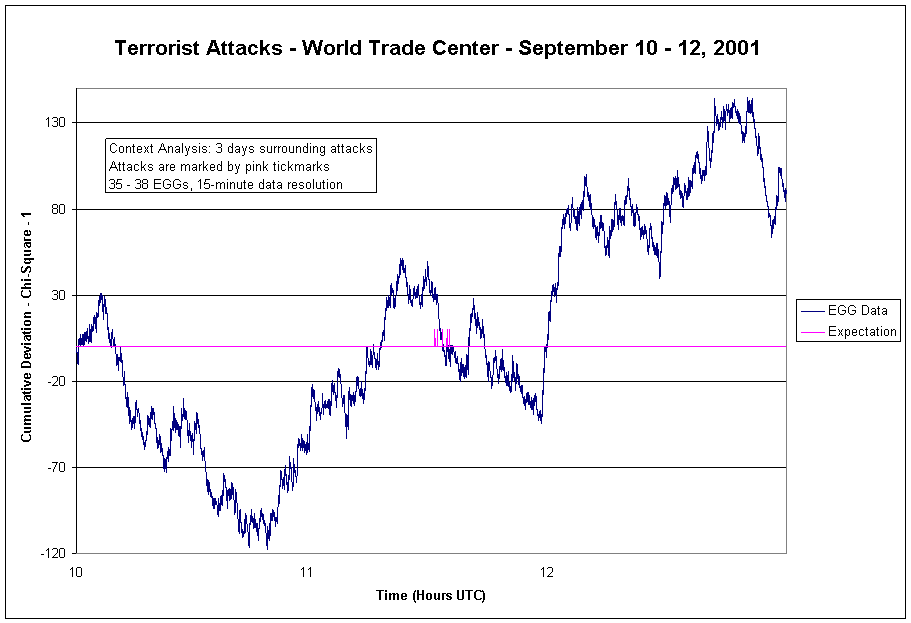
It can be seen that while September 10 starts
with a consistent downward trend that lasts nearly the entire day, there
is an inflection close to the beginning of September 11 that leads into
a rather consistent positive trend that lasts well into September 12.
Moving the contextual view out quite a bit further, Figure 5 shows the full week surrounding September 11 in UTC-measured days.
Moving the contextual view out quite a bit further, Figure 5 shows the full week surrounding September 11 in UTC-measured days.
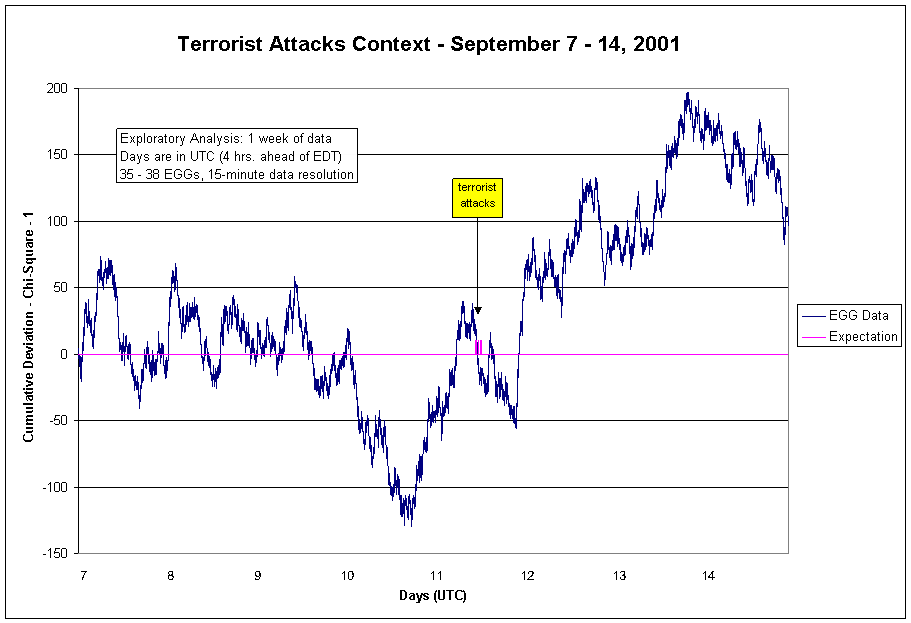
Figure 5. Context graph showing the full week surrounding the events in UTC time, 15-minute resolution, September 7 - 14, 2001.
It is clear that the image does indeed speak
a thousand words, seemingly thrusting before us the powerful, lingering effect
of the disaster in visual form. While there are only random fluctuations
in the network as expected on September 7, 8, & 9 (indicated by the horizontal
zigzagging behavior of the data line around the pink expectation line of
zero), there are clear indications that the data on September 11, 12, &
13 are anything but random, appearing to be highly structured, coherent,
and linear, all of which are things we would rarely (if all) expect to see
in purely random data for long periods of time. The trend is in fact so strong
that it is residual, lasting for nearly 2 days after the attacks! The positive
sloping trend seen in Figure 5 is consistent with the GCP’s own finding over
the same timeperiod in seconds resolution (Nelson, 2002; Nelson, Radin,
Shoup, & Bancel, 2002), which is displayed in Figure 6 below.

Both graphs display very distinct signs that
the data following the attacks were clearly removed from chance expectation
and were extreme in nature, in much contrast with the random data in the
days prior to September 11. It turns out that this powerful and lingering
trend, which lasts about 51 hours total, is so statistically unlikely to
occur in purely random data that we would only see a trend just like it
occurring by chance alone once every 2,300 days (Nelson et al., 2002)!
Informally, this extreme two-day deviation following the attacks on September
11 remains to be the largest randomness deviation anomaly ever observed
in the now 5-year history of the GCP, and so far there is nothing else in
the entire GCP database like it.
Figure 7 shows a closer look at the main part of the trend seen in Figure 5, covering the day of the attack and the two days following.
Figure 7 shows a closer look at the main part of the trend seen in Figure 5, covering the day of the attack and the two days following.
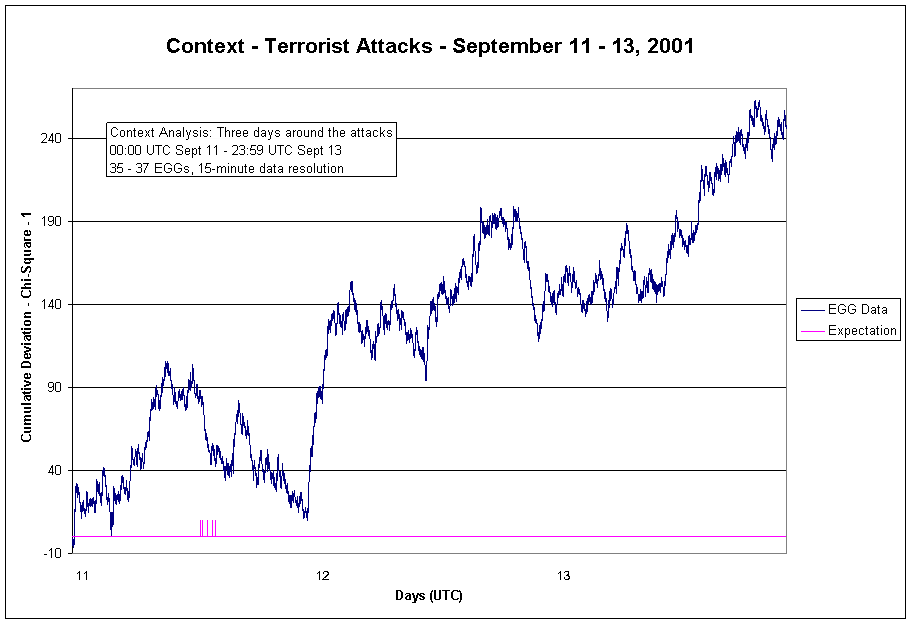
Figure 7. Context graph showing a close-up of the strong positive trend seen in Figure 5 in UTC, 15-minute resolution, September 11 - 13, 2001. The terrorist attacks are indicated by the small group of vertical lines along the pink expectation line of zero.
The graph again shows that the slope of the
trend is positive and nearly linear in its slope, becoming most strong
at around 7:30 P.M. EDT (23:30 UTC), and lasting into September 12 and 13.
Combining the data from these three days post hoc, I find
that the result is significant overall in 15-minute resolution (Chi-square
= 10456.12, 10210 df, p = .043), and still
remains consistent with the GCP finding (Nelson, 2002; Nelson et al., 2002).
Thus, the consistency of this finding across independent studies further
adds support to the likelihood that the result is not a fluke or an artifact,
and that it might represent some indirect indication of a strong “movement”
within the global RNG/EGG network by some external source.
Formal Analysis 2: Standard Variance Among the EGGs
The
second formal test prediction made by the GCP called for looking at the
degree to which the individual z-scores from the 37 global
RNGs/EGGs varied across September 11. Like the Chi-square values, this
variability should theoretically expected to be near zero, indicating little
change at all from chance expectation among the RNGs. To examine this, I
applied the standard measure of variance to the 15-minute data, which is
actually pretty closely related to Chi-square (with only slight differences
statistically), so the results should be consistent with the Chi-square
results. Figure 8 shows this variance measure applied to the early morning
data from September 11.
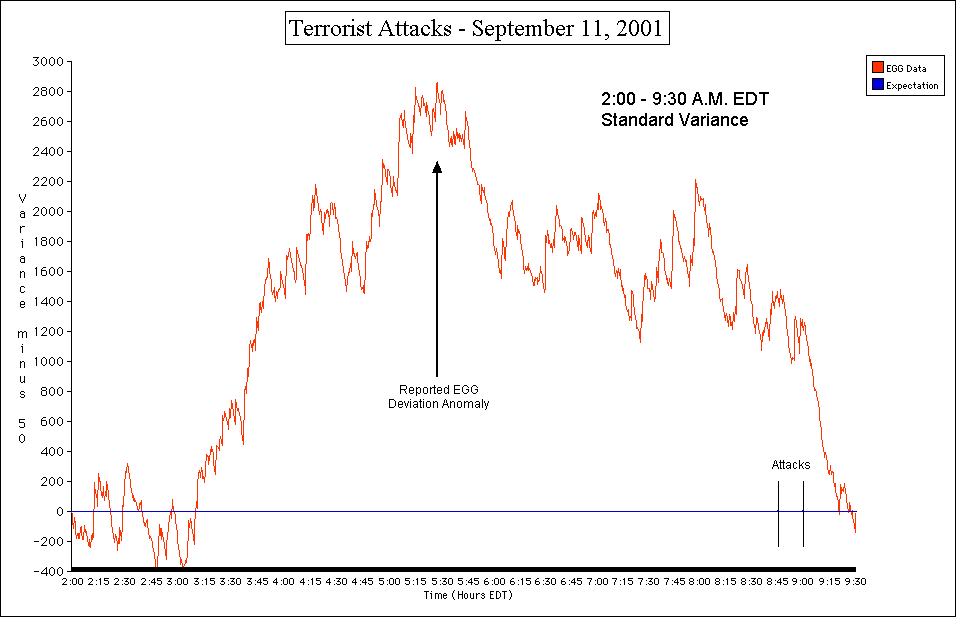
Figure 8. Graph of the standard variance applied to the early morning data in 15-minute resolution, 2:00 - 9:30 A.M. EDT, September 11, 2001.
It can be seen that the result corresponds exactly
with the trend found over the same timeperiod in Figure 5, indicating the
relatedness of the two measures. This graph emphasizes the early morning
“spike” first seen in Figure 5. Taking this early morning rise on its own,
it has an estimated probability of .025 (i.e., odds of about 39 to 1 against
chance occurrence) based on its equivalent Chi-square result, and may therefore
indirectly suggest a sort of “pre-event response” that peaked at around
5:30 A.M. EDT, nearly 3 whole hours before the first plane hit the World
Trade Center! This finding also replicates those that were reported by Dean
Radin (2002), who found a similar positive trend prior to the attacks, and
Richard Shoup (2001), who found a “spike” in the data at around the same
time I did, which had odds of about 131,000 to 1 against chance expectation!
Thus, there is some reason for thinking that this early morning “premonition”
response by the global RNG/EGG network is not a fluke or a statistical artifact,
either.
Autocorrelation and Basic Inter-EGG Correlation Assessment
Another part of the analysis explored in a basic manner the degree to which the global RNGs/EGGs were behaving similar to each other in a correlated fashion during the formal prediction period. This was based on an independent finding by Peter Bancel (2001, in Nelson et al., 2002), in which he had looked at how predictable the RNGs were relative to one another over the course of time, in a sense, using a measure called autocorrelation. Figure 9 shows Bancel’s result.

The
graph of Bancel’s analysis shows that from moment-to-moment up to a period
of one to two hours on the morning of 9/11, the devices within the global
RNG/EGG network were dependent on each other (whereas they should not be
at all in purely random data), which suggests that there was a pattern of
order among the random data of the RNGs on September 11 when in fact there
should not have been one at all.
Early on, Bancel indicated that this predictability in the RNGs on September 11 might have been driven in part by a large deviation from chance expectation that collectively occurred in the z-scores between 9:50 and 11:50 A.M. EDT. In attempt to verify that finding in 15-minute resolution, I plotted the cumulative deviation of the individual 15-minute z-scores, which could serve as a basic indicator of intercorrelation among the RNGs if the z-scores cumulatively sum in a positive trend of deviation over a long period. Figure 10 shows the result of this.
Early on, Bancel indicated that this predictability in the RNGs on September 11 might have been driven in part by a large deviation from chance expectation that collectively occurred in the z-scores between 9:50 and 11:50 A.M. EDT. In attempt to verify that finding in 15-minute resolution, I plotted the cumulative deviation of the individual 15-minute z-scores, which could serve as a basic indicator of intercorrelation among the RNGs if the z-scores cumulatively sum in a positive trend of deviation over a long period. Figure 10 shows the result of this.
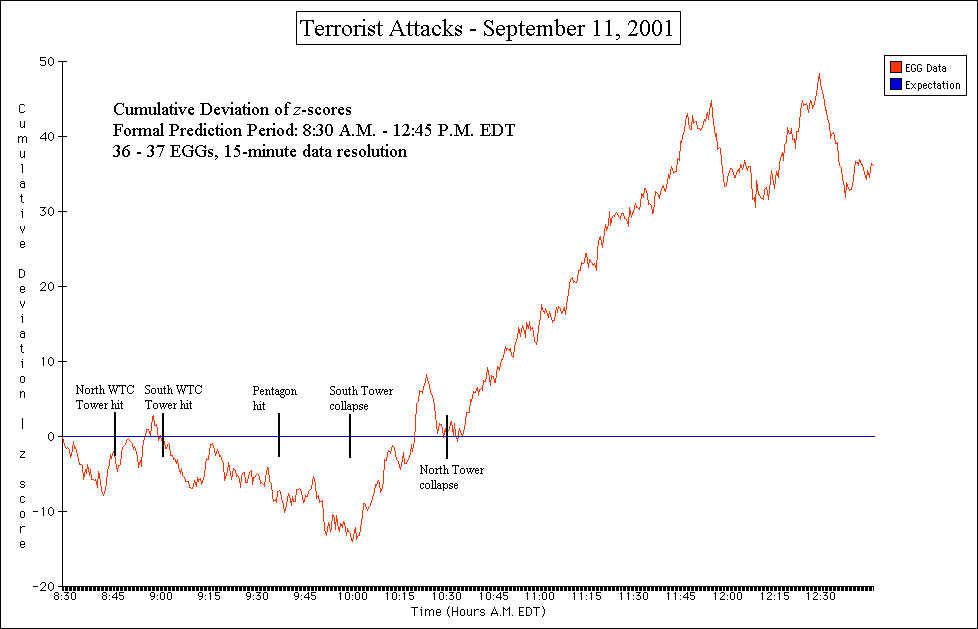
The
resulting graph does indeed indicate that, while there is random walk during
the major events, there is indeed a strong trend between 9:50 and 11:50
A.M. that appears in the 15-minute data. An estimate of the odds that this
9:50 to 11:50 trend on its own is not due to chance alone (as given by Bancel)
is about 400 to 1 (z = 3.71, p = .0025)!
The result further stands out as a strong peak within the context of whole
day, which is shown in Figure 11 below.
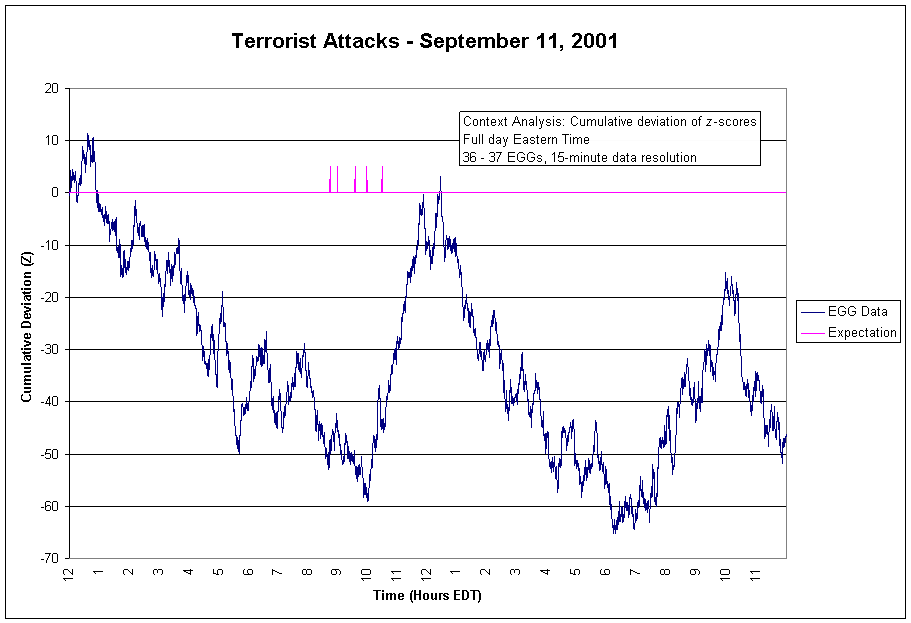
Figure 11. Graph of the cumulative deviation of the 15-minute z-scores for the full day in Eastern time, September 11, 2001. The terrorist attacks are indicated with vertical tickmarks along the expectation line of zero.
This is consistent with the
GCP finding and Bancel’s suggestion, and seems to suggest that there was
a high degree of intercorrelation among the EGGs around the time that the
World Trade Center
Odds Ratio Analyses
Another way it is also possible to assess the degree to which the global RNGs/EGGs “reacted” together in unison is to combine them into a single measure of their collective deviation from expectation (represented by a Stouffer’s Z-score), and then determining the probability of how likely this is due to chance alone through an odds ratio. This was done over every second of the entire day of September 11 in Eastern time, and Figure 12 shows the odds against chance for the resulting Z-scores over time.
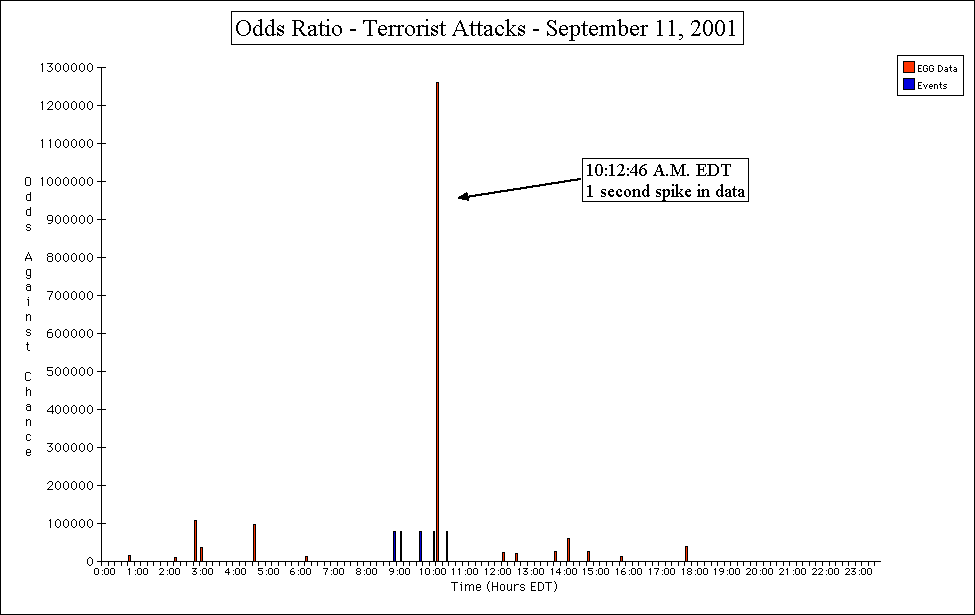
As can be seen, there were interesting values
around 3:00 and 5:00 A.M., which seem to be consistent with the variance
change in Figure 8, but clearly the most interesting of all is the very
tall spike in the middle of the graph, occurring at 10:12:46 A.M., about
14 minutes after the South Tower of the World Trade Center had collapsed.
This was a moment in which the EGGs were so highly correlated with each
other that it was associated with a z-score of 4.80, a value
so extreme that it has odds against chance of over a million to one (p = 7.93 x 10⁻⁷)!
Although a value like this is incredible, one like it is expected to occur by chance alone every 15 days or so, and analysis by the GCP reveals that one does (May & Spottiswoode, 2001; Nelson, 2002; Shoup, 2001). So it is perhaps not too surprising that one appeared in the data, since it could be just a chance fluctuation, although it is somewhat odd as to why it appeared in the middle of the attacks. Some of the GCP researchers suggested that it was merely a fortuitous event (May & Spottiswoode, 2001), although from a personal viewpoint I’m not so sure about this and remain neutral.
I also examined the degree to which the variance among the global RNGs changed daily over the entire week surrounding September 11 by representing the variance change in the form of a 15-minute block z-score combined across all the RNGs, and determining its associated odds against chance. Figure 13 shows the resulting z-scores over the period from September 7 – 13, 2001, with each of the “0”s on the graph indicating midnight in Universal Coordinate Time. In this kind of graph, any scores that are within the range of +2 and -2 are likely to be due to the noise found within the global RNG/EGG network, while any scores outside of this range are interesting from a statistical approach.
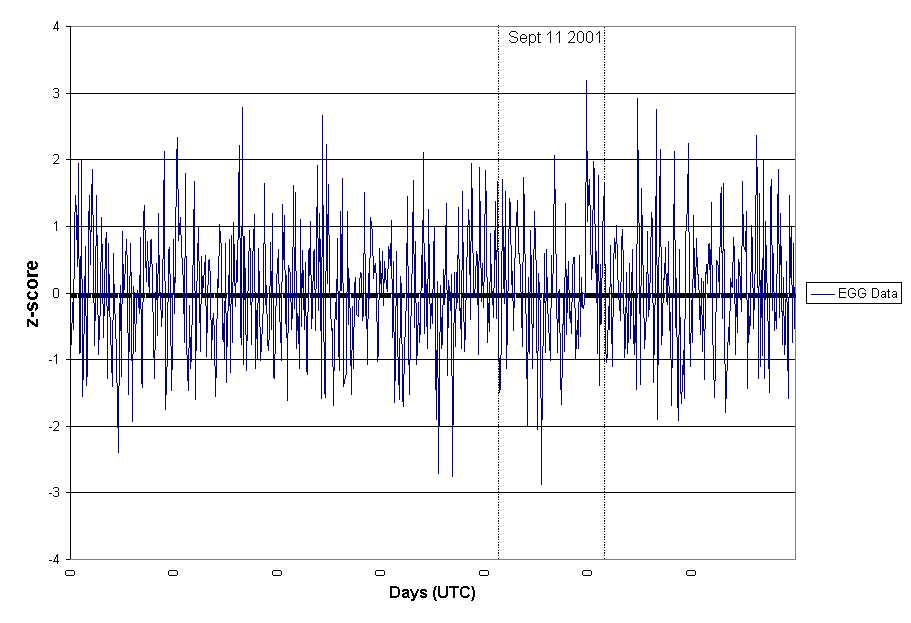
It can be seen from looking at the graph that
the largest daily changes in variance (both positive and negative) among
the EGGs over the entire week had both taken place on September 11. The
largest negative variance change had occurred at 13:00 UTC (9:00 A.M. EDT),
and had a z-score of -2.87 (p = .002).
Figure 14 shows the odds against chance (one-tailed) associated with this
z-score and other negative ones seen throughout the week.
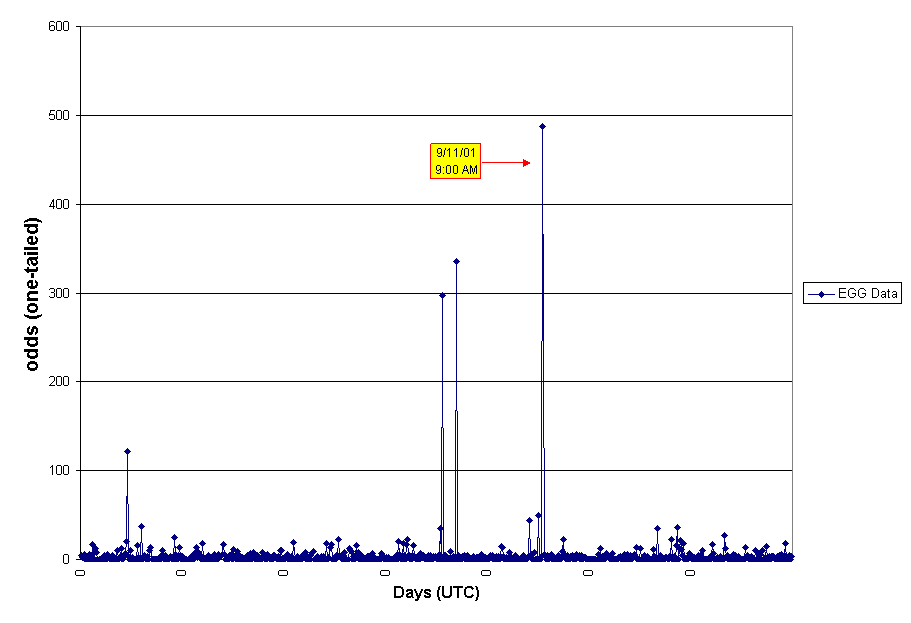
It should be noted that this block z-score is the collective result for data across the 15-minute
period from 9:00 – 9:15 A.M., so it is not necessarily indicative of a “spike”
exactly at 9:00 A.M., but rather is a result from combining data associated
with the time of the second plane crashing into the World Trade Center towers
and the time after it. Its odds are in the range of about 499 to 1 against
chance expectation.
The largest positive variance change had occurred later in the day, at 23:30 UTC (7:30 P.M. EDT), and had a z-score of 3.19 (p = .0007). Figure 15 shows the odds against chance (two-tailed) associated with the z-scores throughout the week.
The largest positive variance change had occurred later in the day, at 23:30 UTC (7:30 P.M. EDT), and had a z-score of 3.19 (p = .0007). Figure 15 shows the odds against chance (two-tailed) associated with the z-scores throughout the week.
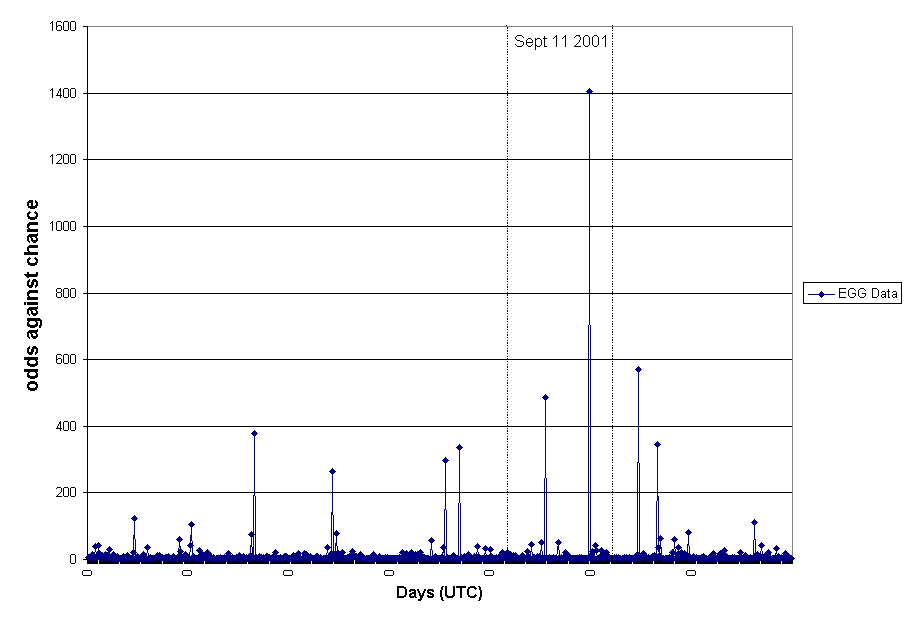
Figure 15. Associated two-tailed odds against chance for the z-scores shown in Figure 12. The zeros along the x-axis indicate midnight UTC of each day.
It is obvious from the graph
that this evening change in variance at 7:30 P.M. is the most extreme of
the entire week, and it is also consistent with the very steep and powerful
increasing trend in the full day result shown in Figure 3. The result is
so extreme that it has odds of about 1,428 to 1 against chance expectation!
These results are also very similar to the results of a similar analysis
of the daily variance change by Dean Radin (2001), who also found “spikes”
like this in his analysis.
Exploratory Analysis: Heroic Sacrifice Aboard Flight 93
Of the four commercial airliners hijacked and taken over by the terrorists that fateful morning, only three of them had actually struck their intended targets. The fourth plane, United Airlines Flight 93 out ofBoston Pennsylvania
Exploratory Analysis: Heroic Sacrifice Aboard Flight 93
Of the four commercial airliners hijacked and taken over by the terrorists that fateful morning, only three of them had actually struck their intended targets. The fourth plane, United Airlines Flight 93 out of
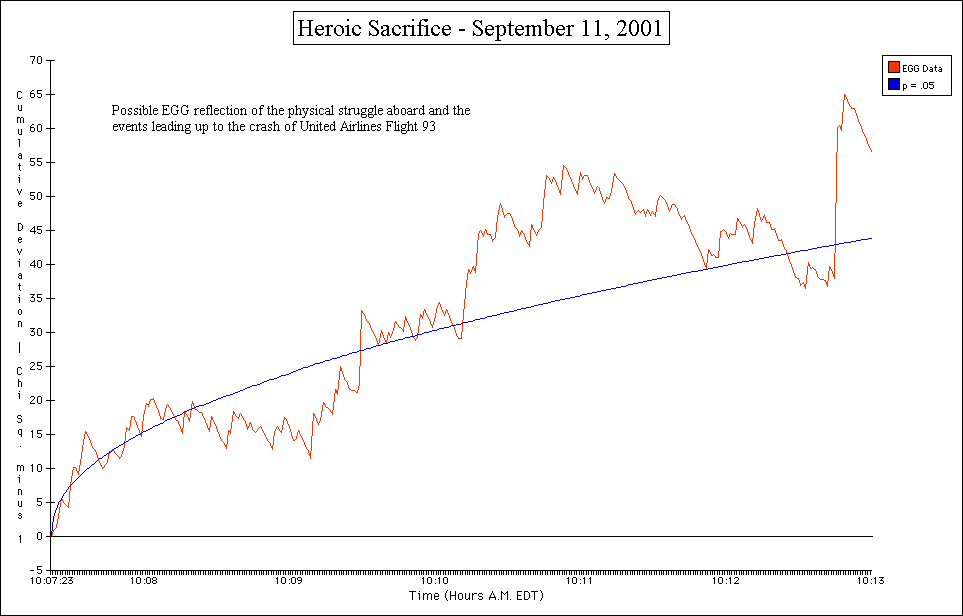
Figure 16. Graph of cumulative deviation of Chi-square for the six-minute time-period presumed to be associated with the heroic struggle aboard Flight 93, 10:07 – 10:13 A.M. EDT, September 11, 2001. The blue arc indicates the location of statistical significance (odds of 20 to 1 against chance) lies as time passes.
Figure 16 shows the result. As can be seen, the data line fluctuates
and zigzags greatly throughout the six-minute period, again possibly reflective
of the panic, confusion, and fear that may have erupted aboard Flight 93.
There clearly a rather strong deviation in the latter part of the timeperiod,
which, in some meaningful way, could be a “signature” of the struggle. Then
there is a sharp peak towards the end, where the data are driven by that
large “spike” seen above in Figure 11 at 10:12:46 A.M. The rest of the data
line began to fall moderately downward beyond the graph up until 10:30 A.M.,
which shows a negative signature similar to a few other GCP analyses relating
to airplane crashes.
Exploratory Analysis: Effect Size for September 11 with Location
Figure 17 shows a graph of a relative measure of the magnitude of the effect of the September 11 deviations as they are distributed across the entire global RNG/EGG network, which is terms of 15-minute block Stouffer’s Z-scores.
Exploratory Analysis: Effect Size for September 11 with Location
Figure 17 shows a graph of a relative measure of the magnitude of the effect of the September 11 deviations as they are distributed across the entire global RNG/EGG network, which is terms of 15-minute block Stouffer’s Z-scores.
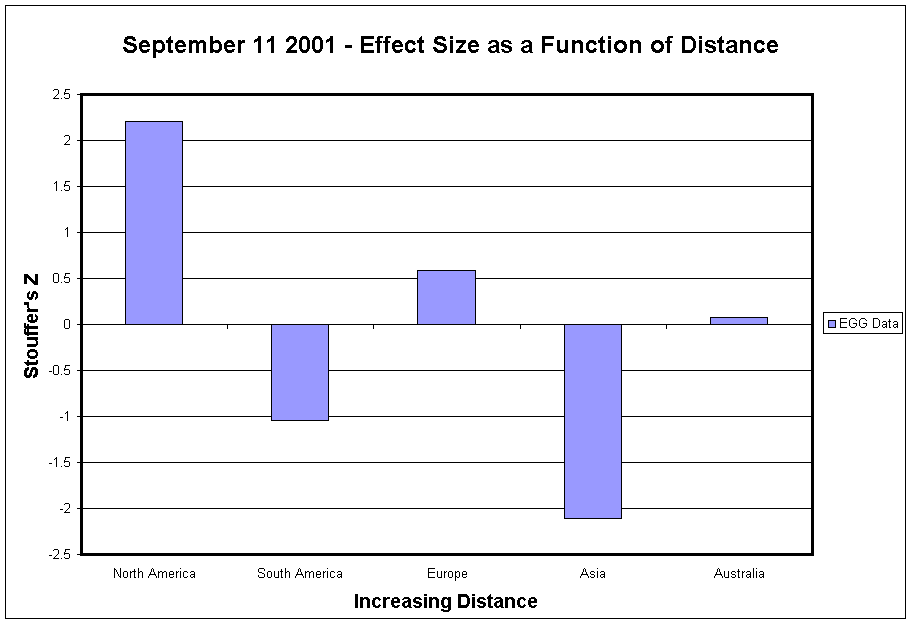
As we might expect, the largest
effect was centered in North America , having a z-score of 2.21. Exploring
further this possibility of effect size as a function of geographical location,
I found that the effect was indeed focused more in the Western Hemisphere
(z = 1.73) as compared to the Eastern Hemisphere (z = - .502), and that with the United States, the effect was
centered most in the Midwest (z = 2.52), moderately in
the East Coast (z = 1.72), and least in the West Coast
(z = - .68). This is similar to the effect size explorations
with distance carried out by Dean Radin (2001) and Roger Nelson (2003),
who both found similar effect sizes distributed in nearly the same areas.
Discussion and Conclusion: What Could It All Mean?
In all, the results of the exploratory analysis of the 9/11 GCP data done by myself and those done by other independent researchers within the GCP seem to collectively provide some indication of small but statistically measurable randomness deviation anomalies being present within the data recorded by the global network of random number generators on that terrible day. In attempting to make sense of the anomalies, there are a few interpretations we might consider.
The first (and perhaps most important) interpretation is that the anomalies have a rational explanation. This interpretation implies that the anomalies were naturally caused by extreme conditions within the environment around the time of the terrorist attacks, which could include sudden electrical disruptions or power surges around urban areas as a result of the disaster, and increased electromagnetic interference from growing use of televisions, radios, and cellular phones with time. While this interpretation is plausible, it is rather highly unlikely to be true in this case for 4 reasons: 1.) the RNG anomalies are spread out across the network, as basically indicated by the effect size exploration and inter-EGG correlation results, and any extreme condition would probably have only been localized to major metropolitan areas such as New York City, so it is not feasible that a localized extreme condition could have affected the entire worldwide network, 2.) there is evidence to suggest that some of the RNG anomalies occurred several hours before the attacks began in New York and Washington, 3.) the RNG are specially designed to block out electromagnetic interference; and 4.) a basic examination of the natural changes in electromagnetism due to power usage by Dean Radin (2002) indicated no differences between day and night in the power usage around September 11. For these reasons, the idea that the September 11 RNG anomalies have natural causes from the environmental conditions that day does not seem likely.
We must also consider the possibility that results are due to statistical error or chance expectation (Scargle, 2002). The former does not seem very likely either, given that the results have reproduced among a number of independent researchers using the same data, and my own exploratory analysis looked at the possibility that the results could have been produced through the statistical “inflation” of purely random data such that it looks like it is non-random and anomalous, but really isn’t. Given that the same statistically significant trends were found across time ranges from second-by-second to 15-minute block periods, there is little indication that these results are statistical artifact. The latter possibility of chance expectation is still feasible and can never totally be ruled out, but the results do argue against it.
Thus, although we cannot conclude that the results show definitive evidence for it, the most sound explanation is perhaps we detected the psi “signature” of a developing global consciousness being shared by the minds of people around the world as they turned their attention toward the terrorist attacks and responded with similar emotions to them, which had the ability to momentarily disrupt the natural behavior of random physical systems around the world in a very powerful way. It should be noted that the global consciousness effects seen in the global RNG/EGG network possess characteristics that are very similar to those of PK (or “mind over matter”) effects, and suggests that the two might have a common basis. The clearest possible indications of this that come from the 9/11 results include that RNGs all over the world were affected, even far from the source of the main events (Dunne & Jahn, 1992); the trends seemed to be correlated with the severe and widespread emotional response to the attacks, which is consistent with a growing indication of a possible correlation between PK effects and emotional expression (e.g., Bierman, 1996; Blasband, 2000); and perhaps most intriguing of all, the response of the RNGs seemed to begin several hours before the attacks began to unfold, which seems to be consistent with the evidence for retroactive (i.e., “backwards acting in time”) PK effects on RNG data (e.g., Bierman, 1998; Schmidt, 1976, 1993). The effects also seem to be similar to the recent experimental findings on presentiment, in which an anticipatory-related change in electrodermal activity is observed prior to viewing emotionally-charged pictures, especially those that are of a violent and disturbing nature (Bierman & Radin, 1999), suggesting that this early morning anomaly may reflect sort of an anticipatory, emotion-related PK response to the terrible events by a supposed global consciousness. This would also be similar, and may perhaps even be in some way related to the many subjective reports of premonitions relating to the devastating events in the hours and days before September 11 (Carpenter, 2002). Thus, there is still much we do not understand about a supposed global consciousness, but the effects of this far-reaching historical event have given us several hints about its nature.
Almost important as any kind of scientific evidence is the importance of meaning. The bottom line is, if a global consciousness does exist and it formed among all of us that morning, then it appears to have been greatly moved by the events of September 11, 2001. The results seem to reflect the mass waves of depression and fear that seem to have engulfed the entire world and lingered aroundNew York City Manhattan
Discussion and Conclusion: What Could It All Mean?
In all, the results of the exploratory analysis of the 9/11 GCP data done by myself and those done by other independent researchers within the GCP seem to collectively provide some indication of small but statistically measurable randomness deviation anomalies being present within the data recorded by the global network of random number generators on that terrible day. In attempting to make sense of the anomalies, there are a few interpretations we might consider.
The first (and perhaps most important) interpretation is that the anomalies have a rational explanation. This interpretation implies that the anomalies were naturally caused by extreme conditions within the environment around the time of the terrorist attacks, which could include sudden electrical disruptions or power surges around urban areas as a result of the disaster, and increased electromagnetic interference from growing use of televisions, radios, and cellular phones with time. While this interpretation is plausible, it is rather highly unlikely to be true in this case for 4 reasons: 1.) the RNG anomalies are spread out across the network, as basically indicated by the effect size exploration and inter-EGG correlation results, and any extreme condition would probably have only been localized to major metropolitan areas such as New York City, so it is not feasible that a localized extreme condition could have affected the entire worldwide network, 2.) there is evidence to suggest that some of the RNG anomalies occurred several hours before the attacks began in New York and Washington, 3.) the RNG are specially designed to block out electromagnetic interference; and 4.) a basic examination of the natural changes in electromagnetism due to power usage by Dean Radin (2002) indicated no differences between day and night in the power usage around September 11. For these reasons, the idea that the September 11 RNG anomalies have natural causes from the environmental conditions that day does not seem likely.
We must also consider the possibility that results are due to statistical error or chance expectation (Scargle, 2002). The former does not seem very likely either, given that the results have reproduced among a number of independent researchers using the same data, and my own exploratory analysis looked at the possibility that the results could have been produced through the statistical “inflation” of purely random data such that it looks like it is non-random and anomalous, but really isn’t. Given that the same statistically significant trends were found across time ranges from second-by-second to 15-minute block periods, there is little indication that these results are statistical artifact. The latter possibility of chance expectation is still feasible and can never totally be ruled out, but the results do argue against it.
Thus, although we cannot conclude that the results show definitive evidence for it, the most sound explanation is perhaps we detected the psi “signature” of a developing global consciousness being shared by the minds of people around the world as they turned their attention toward the terrorist attacks and responded with similar emotions to them, which had the ability to momentarily disrupt the natural behavior of random physical systems around the world in a very powerful way. It should be noted that the global consciousness effects seen in the global RNG/EGG network possess characteristics that are very similar to those of PK (or “mind over matter”) effects, and suggests that the two might have a common basis. The clearest possible indications of this that come from the 9/11 results include that RNGs all over the world were affected, even far from the source of the main events (Dunne & Jahn, 1992); the trends seemed to be correlated with the severe and widespread emotional response to the attacks, which is consistent with a growing indication of a possible correlation between PK effects and emotional expression (e.g., Bierman, 1996; Blasband, 2000); and perhaps most intriguing of all, the response of the RNGs seemed to begin several hours before the attacks began to unfold, which seems to be consistent with the evidence for retroactive (i.e., “backwards acting in time”) PK effects on RNG data (e.g., Bierman, 1998; Schmidt, 1976, 1993). The effects also seem to be similar to the recent experimental findings on presentiment, in which an anticipatory-related change in electrodermal activity is observed prior to viewing emotionally-charged pictures, especially those that are of a violent and disturbing nature (Bierman & Radin, 1999), suggesting that this early morning anomaly may reflect sort of an anticipatory, emotion-related PK response to the terrible events by a supposed global consciousness. This would also be similar, and may perhaps even be in some way related to the many subjective reports of premonitions relating to the devastating events in the hours and days before September 11 (Carpenter, 2002). Thus, there is still much we do not understand about a supposed global consciousness, but the effects of this far-reaching historical event have given us several hints about its nature.
Almost important as any kind of scientific evidence is the importance of meaning. The bottom line is, if a global consciousness does exist and it formed among all of us that morning, then it appears to have been greatly moved by the events of September 11, 2001. The results seem to reflect the mass waves of depression and fear that seem to have engulfed the entire world and lingered around
Acknowledgments
I must thank Dr. Roger
Nelson of the Global Consciousness Project for technical advice and comments
on my GCP work, Steven Kindsvater-Novak of Fort Hays State University
References (in order of text citation)Nelson, R. D. (2001).
Correlation of global events with REG data: An Internet-based, nonlocal
anomalies experiment. Journal of Parapsychology 65(3), September.
pp. 247 – 271.
Nelson, R. D. (2002). Coherent consciousness and reduced randomness: Correlations on September 11, 2001. Journal of Scientific Exploration 16(4), Winter. pp. 549 - 570.
Nelson, R. D., Radin,D. I.
Radin,D. I.
Shoup, R. (2001). EGG salad - Comments on the GCP EGG data for September 11, 2001. Boundary Institute Technical Report, November 6. Available over the Internet at: http://www.boundary institute.org/articles/EGG_Salad.pdf. Downloaded November 12, 2001.
May, E. C., & Spottiswoode, S. J. P. (2001). Global Consciousness Project: An independent analysis of the 11 September 2001 events. Available over the Internet at: http://noosphere.princeton.edu/papers/Sep1101.pdf. Downloaded November 12, 2001.
Radin, D. I. (2001). Global Consciousness Project analysis for September 11, 2001. Global Consciousness Project draft report, September 21. Available over the Internet at: http://noosphere.princeton.edu/dean/wtc0921.html. Downloaded October 2, 2001.
Nelson, R. D. (2003). What kind of events have effects? Global Consciousness Project exploratory analysis, February 28. Available over the Internet at: http://noosphere.princeton.edu/categories.html. Downloaded May 13, 2003.
Scargle, J. D. (2002). Commentary: Was there evidence of global consciousness on September 11, 2001? Journal of Scientific Exploration 16(4), Winter. pp. 571 - 577.
Dunne, B. J., & Jahn, R. G. (1992). Experiments in remote human/machine interaction. Journal of Scientific Exploration 6(4), Winter. pp. 311 - 322.
Bierman, D. J. (1996). Exploring correlations between local emotional and global emotional events and the behavior of a random number generator. Journal of Scientific Exploration 10(3), Autumn. pp. 363 - 373.
Blasband, R. A. (2000). The ordering of random events by emotional expression. Journal of Scientific Exploration 14(2), Summer. pp. 195 - 216.
Bierman, D. J. (1998). Do psi phenomena suggest radical dualism? In S. R. Hameroff, A. W. Kazniak, & A. C. Scott (Eds.) Toward a Science of Consciousness II: The Second TUSCON Discussions and Debates (pp. 709 - 713).Cambridge , MA
Schmidt, H. (1976). PK effect on pre-recorded targets. Journal of the American Society for Psychical Research 70(3), July. pp. 267 - 291.
Schmidt, H. (1993). Observation of a psychokinetic effect under highly controlled conditions. Journal of Parapsychology 57(4), December. pp. 351 - 372.
Bierman, D. J., & Radin,D. I. Cambridge , MA
Carpenter, J. (2002). Guest editorial: Why parapsychology now? Journal of Parapsychology 66(4), December. pp. 339 - 342.
Galea, S., Ahern, J., Resnick, H., Kilpatrick, D., Bucuvalas, M., Gold, J., & Vlahov, D. (2002). Psychological sequelae of the September 11 terrorist attacks inNew York City New England Journal of Medicine 346(13), March 28. pp. 982 - 987.
Williams, B. J. (2003). Consciousness
and global random systems: An independent exploratory block analysis of the
correlations on September 11, 2001. Submitted to the Global Consciousness
Project June 26, 2003.
Created: August 12, 2002
Revised: September 10, 2003
Nelson, R. D. (2002). Coherent consciousness and reduced randomness: Correlations on September 11, 2001. Journal of Scientific Exploration 16(4), Winter. pp. 549 - 570.
Nelson, R. D., Radin,
Radin,
Shoup, R. (2001). EGG salad - Comments on the GCP EGG data for September 11, 2001. Boundary Institute Technical Report, November 6. Available over the Internet at: http://www.boundary institute.org/articles/EGG_Salad.pdf. Downloaded November 12, 2001.
May, E. C., & Spottiswoode, S. J. P. (2001). Global Consciousness Project: An independent analysis of the 11 September 2001 events. Available over the Internet at: http://noosphere.princeton.edu/papers/Sep1101.pdf. Downloaded November 12, 2001.
Radin, D. I. (2001). Global Consciousness Project analysis for September 11, 2001. Global Consciousness Project draft report, September 21. Available over the Internet at: http://noosphere.princeton.edu/dean/wtc0921.html. Downloaded October 2, 2001.
Nelson, R. D. (2003). What kind of events have effects? Global Consciousness Project exploratory analysis, February 28. Available over the Internet at: http://noosphere.princeton.edu/categories.html. Downloaded May 13, 2003.
Scargle, J. D. (2002). Commentary: Was there evidence of global consciousness on September 11, 2001? Journal of Scientific Exploration 16(4), Winter. pp. 571 - 577.
Dunne, B. J., & Jahn, R. G. (1992). Experiments in remote human/machine interaction. Journal of Scientific Exploration 6(4), Winter. pp. 311 - 322.
Bierman, D. J. (1996). Exploring correlations between local emotional and global emotional events and the behavior of a random number generator. Journal of Scientific Exploration 10(3), Autumn. pp. 363 - 373.
Blasband, R. A. (2000). The ordering of random events by emotional expression. Journal of Scientific Exploration 14(2), Summer. pp. 195 - 216.
Bierman, D. J. (1998). Do psi phenomena suggest radical dualism? In S. R. Hameroff, A. W. Kazniak, & A. C. Scott (Eds.) Toward a Science of Consciousness II: The Second TUSCON Discussions and Debates (pp. 709 - 713).
Schmidt, H. (1976). PK effect on pre-recorded targets. Journal of the American Society for Psychical Research 70(3), July. pp. 267 - 291.
Schmidt, H. (1993). Observation of a psychokinetic effect under highly controlled conditions. Journal of Parapsychology 57(4), December. pp. 351 - 372.
Bierman, D. J., & Radin,
Carpenter, J. (2002). Guest editorial: Why parapsychology now? Journal of Parapsychology 66(4), December. pp. 339 - 342.
Galea, S., Ahern, J., Resnick, H., Kilpatrick, D., Bucuvalas, M., Gold, J., & Vlahov, D. (2002). Psychological sequelae of the September 11 terrorist attacks in
Created: August 12, 2002
Revised: September 10, 2003